
You may have noticed that there are some new filters in your Investor Dashboard when you log in to VIAINVEST. We are trying to provide as much quality information as we can and put it in the simplest format possible. Let’s check out what these new filters are and what they do.
The New Look
Here’s what you see when you log in now.
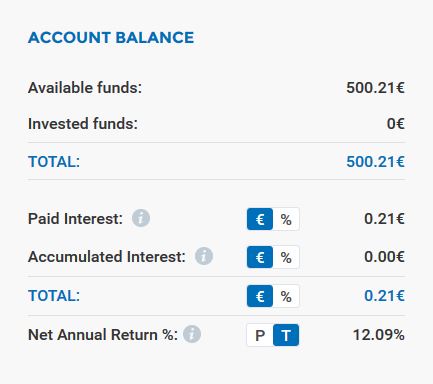
12.09% return is pretty sweet so far.
There’s lots of new information about your account and investment returns available on this page.
- Available funds is your cash available,
- Invested funds is your amount of funds invested in VIAINVEST loans,
- Paid Interest is the amount of Interest you have been paid so far. Note that you can toggle between EUR and % in case you want the cash value of your Interest earned or the % rate of return to compare to other investments,
- Accumulated Interest is the Interest due but not yet paid on your loans. You can toggle between EUR and % on this one too. The percentage rate shows expected earnings based on the initial amount invested,
- Net Annual Return is an annualized rate of return that uses the XIRR methodology otherwise known as Modified Internal Rate of Return. XIRR is commonly used in p2p lending returns since we have an ‘irregular set of cash flows’ or different amounts of payments coming in at different times. A great video tutorial of XIRR can be found here on YouTube if you want to learn more. An additional feature on Net Annual Return is that you can toggle between the Paid amount (P) and the Total amount (T) where Total incorporates the Accumulated Interest although that Interest has not yet been paid.
Custom Charting
At the bottom of the Dashboard, you can chart your own investment progress with your own custom X and Y axis for periods of time from one day up to 6 months.

Your custom choices for the vertical Y axis include Portfolio, Interest Earned or Invested Funds. For the horizontal X axis, your choices are Loan Type, Loan Amount, Loan Status (payment status of current or overdue) and Country.
So one example would be to set the Y axis at Portfolio and the X axis at Country and then you would see the percentage breakdown of loans per country. Keeping the X axis at Country but setting the Y axis at Invested Funds shows your cash breakdown of how much you have invested in Spain vs how much you invested in the Czech Republic.
If you wanted to calculate something closer to Return on Investment (ROI) instead of XIRR you can set the Y to Interest Earned and the X to Loan Amount and divide to get a number very close to ROI. Play around with the filters and see how the visual information from the chart helps you make investment decisions.
Comment below to tell us how you are using these new features and what additional features you would like to see!